A funnel report is your window into what's actually happening in your sales process. It tracks how prospects move through each stage of your funnel and identifies where you're losing people (and money).
Without a proper funnel report, you're likely to make decisions based on feelings instead of facts. You might think your webinar is converting well because you closed three deals last month, but the data might show you had 500 attendees. That's a 0.6% conversion rate – pretty terrible for most business models.
In this article, I’ll share the type of funnel reports and how you can create one for your online business.
But first…
How do funnel reports provide valuable insight into your customer journey?
Your customers don't follow a linear path from stranger to buyer. They might download your lead magnet, ignore your emails for two weeks, binge-watch your YouTube videos, then suddenly apply for your high-ticket program.
Funnel reports help you understand these complex journeys so you can create touchpoints that guide prospects toward purchase decisions. They reveal patterns you'd never notice otherwise, like how leads who engage with specific pieces of content are 3x more likely to buy, or how prospects who attend live events close at higher rates.
Funnel reports also give you the objective data you need to make smart optimization decisions. They show you which marketing channels deliver the highest-quality leads, which content keeps people engaged, and where your sales process needs improvement.
This brings us to the next point:
Benefits of a Funnel Report

Every funnel has leaks. The real question is whether you know where they are and how much they’re costing you. Maybe your lead magnet is performing well, but your follow-up emails have dismal open rates. Or perhaps people engage with your content but never take the next step to book a discovery call.
Funnel reports pinpoint these bottlenecks so you can fix them before they affect your conversions or search performance. Instead of guessing, you see exactly where prospects drop off and which stages need the most attention.
This clarity helps you prioritize high-impact fixes, double down on what’s already working, and allocate resources more effectively. Over time, this compounds into higher conversion rates, more qualified leads, and better ROI.
Other benefits are:
1. Helps You Track Conversion Rates at each funnel stage
Conversion rates tell you the story of your funnel's health. If your opt-in page converts at 2% instead of 20%, you know the problem isn't your email sequence. It's your lead magnet or traffic quality.
I track what I call “micro-conversions” throughout the funnel: email opens, link clicks, webinar attendance, application completions, call show-ups. Each metric tells part of the story, and together they reveal exactly what's working and what isn't.
2. Support sales forecasting and business decisions
When you know your funnel metrics, you can predict revenue with scary accuracy. For example, if you know that 1,000 visitors generate 200 leads, 40 applications, 20 sales calls, and 5 clients at $5K each, you can forecast that traffic increases of 50% should generate roughly $37,500 in additional revenue.
This changes everything. You can make confident decisions about ad spend, hiring, and business investments because you understand the math behind your growth.
3. Optimize resource allocation and team performance
Funnel reports show you where to focus your time, budget, and team energy for maximum impact. Maybe you're spending 20 hours per week creating social media content that drives just 5% of your leads, while your email sequence (which takes only 2 hours per month to optimize) drives 60% of your sales.
Without a clear funnel view, it’s easy to keep pouring resources into the wrong activities simply because they’re visible or popular. With the right insights, you can double down on high-performing channels, cut wasted effort, and assign your team to initiatives that actually move the needle.
4. Enable data-driven marketing and sales alignment
When marketing and sales share the same funnel reports, the conversation shifts from finger-pointing to problem-solving. Marketing gains visibility into which leads actually convert, while sales sees which campaigns consistently attract high-quality prospects.
Instead of debating lead quality or questioning each other’s efforts, both teams can operate from a single source of truth. This shared visibility fosters trust, accelerates feedback loops, and helps each side refine their approach in real time. The result is a smoother handoff between marketing and sales, better prioritization of opportunities, and a unified strategy that drives higher conversion rates.
Types of Funnel Reports
Here are the main types of funnel reports:
1. Sales funnel report
This focuses on your sales process. It tracks metrics like call booking rates, show-up rates, proposal acceptance rates, and average deal size.
For most online businesses, your sales funnel can include tracking your discovery call funnel, proposal process, and client onboarding sequence. The goal is to understand exactly how prospects become paying customers and where that process breaks down.
2. Marketing funnel report
This covers the awareness and lead generation side of your business. It tracks how people discover you, what content they engage with, and how they enter your ecosystem. It helps you understand which marketing activities actually drive business results.
Key metrics include traffic sources, content engagement rates, lead magnet performance, and email list growth. Social platforms have become primary discovery channels for many online businesses, but tracking how social engagement translates into funnel progression requires platform-specific metrics and attribution models. For businesses generating significant traffic from Facebook, Instagram, TikTok, or LinkedIn, our Social Media Sales Funnel guide explores how to track engagement, optimize content for conversion, and measure ROI across social channels.
3. Custom funnel reports
Custom funnel reports are tailored analytics dashboards that map the unique steps of your customer journey, showing where prospects engage, drop off, or convert. Unlike generic reports, they’re designed around the specific milestones that matter most to your business model.
For example, a SaaS company might track free trial sign-ups, product activation milestones, and upgrade rates to measure how effectively they turn users into paying subscribers. A course creator, on the other hand, may prioritize module completion rates, course progression, and community engagement to ensure learners stay motivated and finish the program.
Brick-and-mortar businesses face unique funnel tracking challenges around in-store conversions, offline touchpoints, and multi-channel attribution that purely digital businesses don't encounter. Our specialized Retail Sales Funnel guide addresses how physical retailers can integrate online and offline data to understand the complete customer journey from digital discovery to in-store purchase.
How to Build a Funnel Report (Step-by-Step)
Building an effective funnel report isn't complicated, but it requires careful planning and consistent execution.
Step 1: Define the Funnel Stages
Awareness → Interest → Consideration → Decision
Map out your specific customer journey. For a coaching business, this might look like:
Blog reader → Lead magnet download → Email subscriber → Webinar attendee → Application → Discovery call → Client.
Each business will have unique stages depending on offer complexity, sales cycle length, and how prospects engage. For example, B2B services often involve multiple stakeholders, meaning the consideration phase can stretch across weeks or months with multiple touchpoints.
On the other hand, lower-ticket digital products or e-commerce businesses might compress the entire journey into just a few days, moving from ad click → product page visit → checkout in a single session.
Defining these stages clearly will set the foundation for accurate funnel reporting. Without clarity on what each stage means, your data will be inconsistent, making it harder to identify leaks, measure progress, or optimize effectively.
Step 2: Collect Funnel Data
Your funnel is only as strong as the data behind it. While analytics platforms can show you what prospects are doing, your sales team often knows why. They hear common objections, spot buying patterns, and notice lead quality differences that raw numbers can’t capture. That’s why you need sales insights.
Set up systems for sales reps to log detailed notes after each interaction. Even a simple CRM field for “main objection” or “buying trigger” can reveal trends that shape smarter marketing decisions.
At the same time, integrate quantitative data from all your marketing tools: website analytics, email platforms, social media insights, ad dashboards, and automation tools. The goal is to unify these fragmented data points into one complete picture of how prospects move through your funnel.
This often requires connecting multiple sources through tools like Zapier, Make, or custom integrations. For more complex setups, a business intelligence (BI) platform like Google Looker Studio or Power BI can help visualize and centralize your funnel metrics.
When you combine qualitative sales insights with quantitative marketing data, you uncover not just where prospects drop off, but also the reasons behind it and get the clarity needed to fix bottlenecks and improve conversions.
Step 3: Visualize the Funnel
Numbers in a spreadsheet can tell you the story, but visual representation makes that story easier to understand and act on. A well-designed funnel chart instantly shows you where leads are dropping off and how effectively prospects move from one stage to the next.
Here’s an example from GA4:
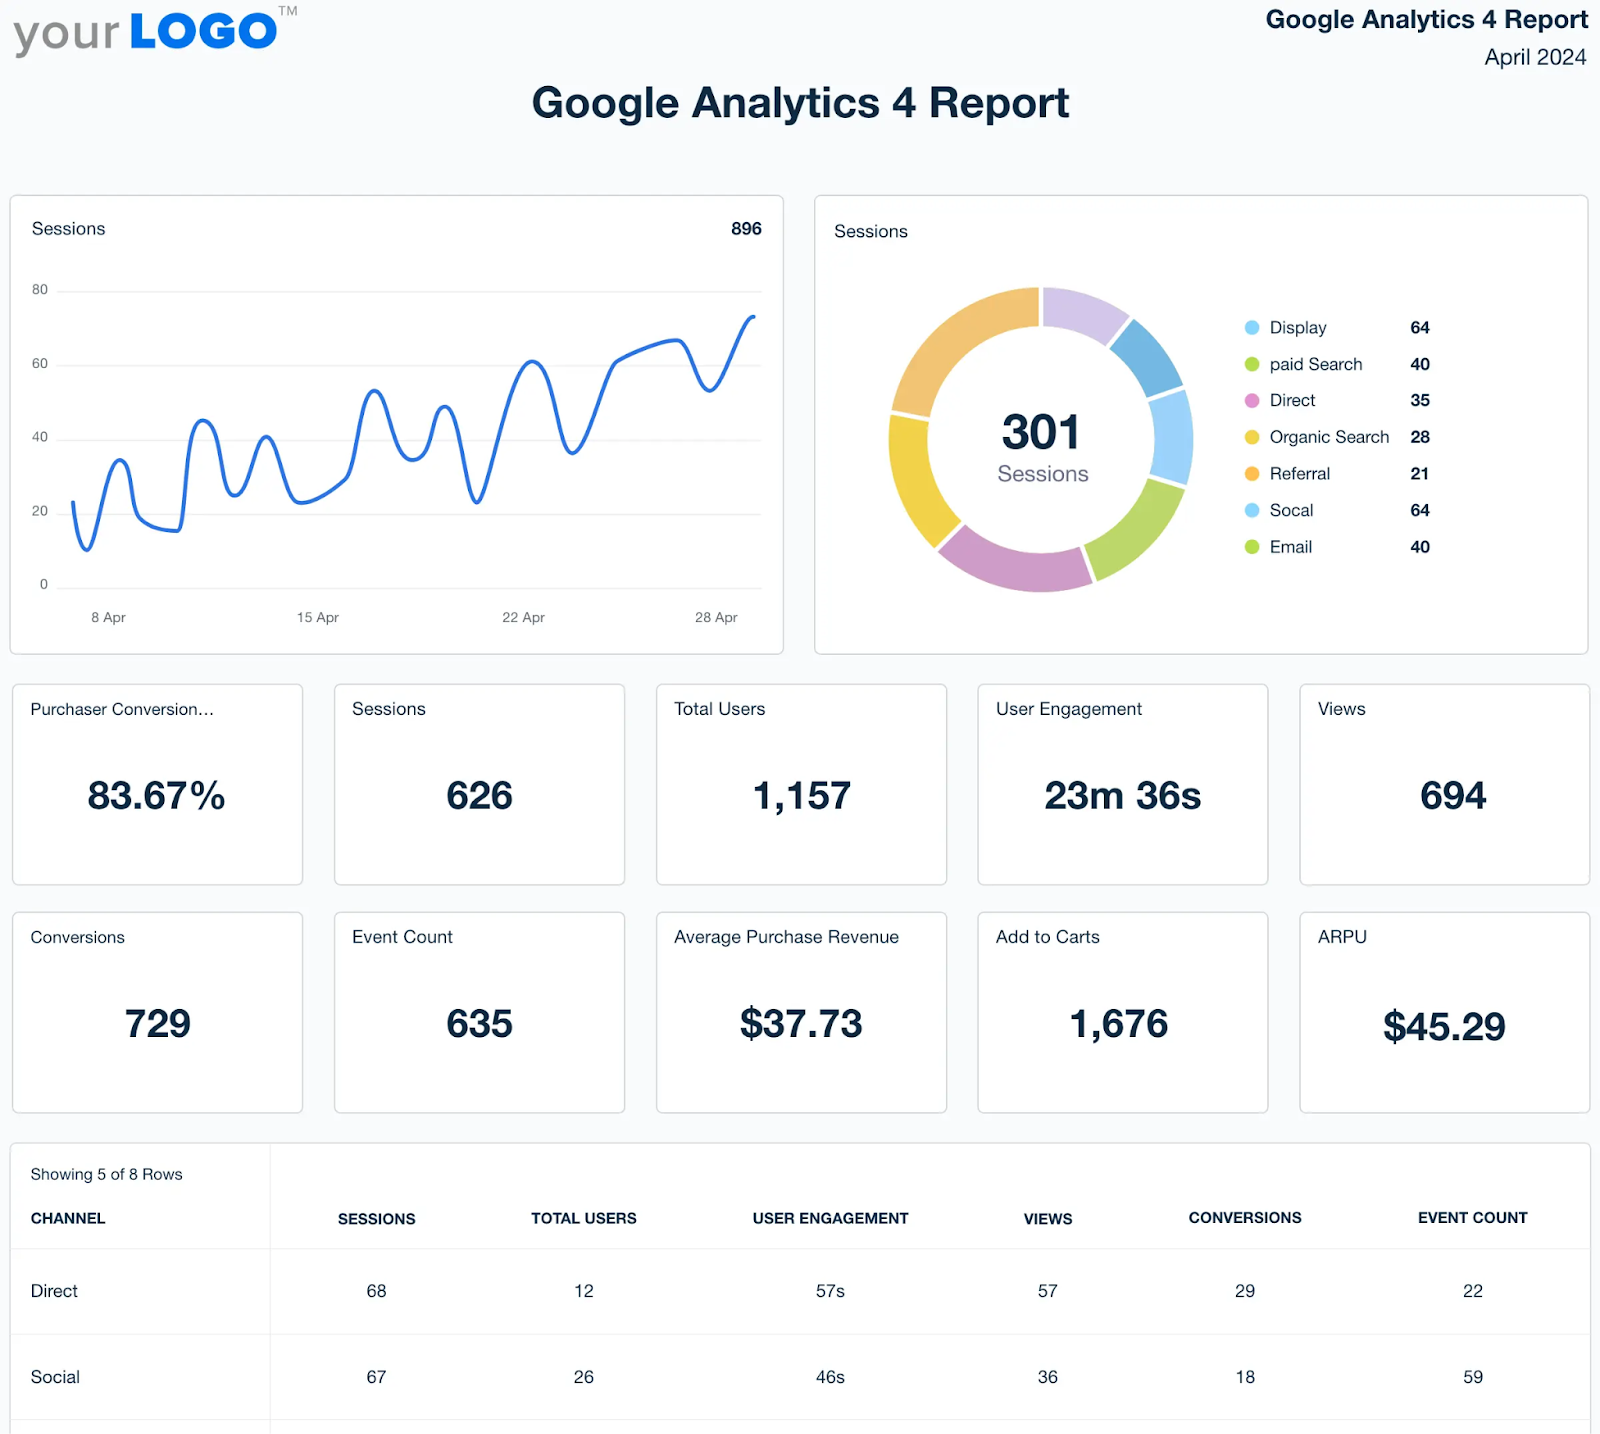
Start simple. A basic funnel chart displaying stage volumes and conversion rates is enough to highlight obvious bottlenecks. As your comfort with the data grows, you can layer in more advanced visualizations such as:
- Time-based trends to spot seasonal dips,
- Cohort analysis to compare how different lead sources perform
- Velocity metrics that show how long prospects spend at each stage.
You don’t need expensive software to get started. Tools like Google Looker Studio, Tableau, Power BI, or even Excel/Google Sheets can visualize funnel performance effectively.
Where possible, create dashboard templates that update automatically by connecting your CRM, analytics, and email platforms. This eliminates manual data entry and ensures the team always works from the most up-to-date information.
Step 4: Analyze & Review Funnel Performance
The real value of funnel reporting comes from interpretation. Your goal is to identify the leaks, inefficiencies, and hidden opportunities inside your funnel. Here are some helpful tips:
- Spot the biggest drop-offs. Not every leak deserves equal attention. A 50% drop from lead magnet download → first email open is far more critical than a 10% drop from webinar → application, because it impacts a much larger pool of leads. Focus first on fixing the stages where you’re losing the most people.
- Track gradual declines. Sometimes performance doesn’t collapse overnight but erodes slowly. Declining conversion rates might signal audience fatigue, increased competition, or even platform algorithm changes. Trend analysis can help you catch these shifts early before they compound.
- Monitor sales velocity. The average time prospects spend in each stage is just as important as the conversion rate. Longer sales cycles aren’t necessarily a problem, but they require different strategies: more nurturing content, extended follow-up, or closer sales support.
- Segment buyer journeys. Some prospects move from awareness to purchase in days, while others take months. By recognizing these patterns, you can design multiple nurture tracks, while slower decision-makers get deeper education and trust-building content.
The key is to treat funnel analysis as an ongoing review process rather than a one-time audit. Schedule regular check-ins (monthly or quarterly) to compare results, update assumptions, and refine your strategy. Over time, these insights compound and allow you to turn raw funnel data into a true growth engine.
Funnel Analytics Tools
1. Google Analytics and HubSpot
Google Analytics 4 has improved funnel tracking capabilities, but it's still primarily focused on website behavior. For most online businesses, you'll need additional tools to track email sequences, sales calls, and customer lifecycle metrics.
HubSpot provides more comprehensive funnel tracking, especially if you're using their CRM and email tools. The ability to track a lead's complete journey from first website visit to closed deal is incredibly powerful for optimization.
2. Funnel reporting tools and dashboards

Tools like Mixpanel, Amplitude, and Hotjar provide deeper insights into user behavior and conversion patterns. For simpler businesses, tools like ConvertKit's reporting or ActiveCampaign's automation reports are just sufficient.
The key is choosing tools that integrate well with your existing tech stack and provide actionable insights without overwhelming complexity.
3. Aligning marketing and sales efforts with CRM
Your CRM should be the source of truth for lead status and conversion data. Whether you're using HubSpot, Pipedrive, or a simpler tool like Notion, make sure it accurately reflects where prospects are in your sales process.
I recommend weekly funnel reviews where marketing and sales teams look at the data together. This alignment prevents finger-pointing and creates collaborative problem-solving around conversion optimization.
How to Optimize Your Sales Funnel with Funnel Reports
Data without action is worthless. The real value of funnel reports comes from using insights to improve your conversion rates and revenue.
1. Automate reports with sales enablement tools
Manual report creation is time-consuming and often inconsistent. Set up automated dashboards that update in real-time so you can spot issues quickly and make faster optimization decisions.
Most CRM and email platforms offer basic automation features. For more advanced setups, consider tools like Zapier to connect different data sources into comprehensive dashboards.
Beyond reporting automation, the funnel itself can operate with minimal manual intervention through sophisticated email sequences, behavioral triggers, and dynamic segmentation. For businesses ready to scale beyond manual outreach, our comprehensive Automated Sales Funnel guide walks through building systems that nurture leads, qualify prospects, and drive conversions automatically while providing the data needed for continuous optimization.
2. Use data for sales prospecting
Funnel data helps identify your best prospects before they reach the sales stage. Leads who engage with specific content, attend live events, or spend significant time on your website are often more qualified than those who simply downloaded your lead magnet. Create lead scoring systems based on engagement patterns, then prioritize your sales efforts accordingly.
3. Create reports that give valuable insights into your sales
The best funnel reports answer specific business questions: Which marketing channels drive the highest-value customers? What content keeps prospects engaged longest? Which objections come up most frequently in sales calls? Structure your reports around these strategic questions rather than just presenting generic metrics.
Common Challenges in Funnel Reporting
Even with good intentions, most businesses struggle with consistent, accurate funnel tracking.
1. Inaccurate sales data
Garbage in, garbage out. If your team isn't consistently updating lead statuses or if your tracking pixels aren't firing properly, your funnel reports will be misleading.
How to solve it: Regular data audits help identify and fix tracking issues before they skew your optimization decisions. Create clear definitions for what constitutes a lead, qualified prospect, sales opportunity, and closed customer. Document these definitions and train your team to use them consistently.
2. Misaligned marketing and sales efforts
One of the most common funnel problems is when marketing and sales operate with different definitions of success. Marketing may consider someone “qualified” as soon as they download a lead magnet, while sales only counts a lead as qualified after a discovery call. These definitional gaps create reporting chaos: marketing celebrates hitting lead targets, while sales complains about “bad leads.”
How to solve it: Establish clear definitions for each funnel stage that both teams agree on and consistently follow. Platforms like HubSpot, ClickFunnels, or custom solutions built with tools like Zapier can automatically connect data from multiple sources into unified reports.
3. Tracking across multiple tools
Most businesses use one tool for website analytics, another for email marketing, a CRM for sales data, and separate dashboards for ads. The challenge is that none of these systems “speak the same language” out of the box. As a result, building a complete funnel report often requires either technical integrations (via tools like Zapier, APIs, or BI platforms) or tedious manual data compilation.
When data stays siloed, it’s almost impossible to see the full customer journey. You might know how many people clicked an ad or opened an email, but without connecting those actions to downstream outcomes like opportunities created or revenue closed you’re only looking at fragments of the picture. Proper integration ensures you can attribute results to the right channels, identify bottlenecks accurately, and make truly data-driven decisions.
How to solve it: Choose tools that integrate well together, or invest in platforms that provide comprehensive funnel tracking in a single dashboard.
Conclusion
The businesses that scale consistently are those that understand their numbers intimately. They know exactly how many leads they need to generate 10 new customers. They know which marketing channels deliver the highest-quality prospects. They know where their sales process breaks down and how to fix it.
That said, start with the templates and frameworks I've outlined here. Track the key metrics, review your data weekly and optimize based on what you find. Most importantly, don't get overwhelmed by trying to track everything at once. Focus on the metrics that directly impact your bottom line.
Ready to dive deeper into building funnels that actually convert? Learn how to analyze and build an effective sales funnel report by joining our high-ticket course, where we break down real client funnels and show you exactly what separates the winners from everyone else. Your future self will thank you for making this investment today.
FAQs About Funnel Reports and Funnel Analysis
Q1. What is the main purpose of a sales funnel report?
The main purpose is to identify exactly where prospects are dropping out of your sales process and why. This allows you to make data-driven optimizations that directly increase revenue.
Q2. How do I know if my funnel is effective?
Compare your funnel metrics to industry benchmarks and your own historical performance. More importantly, track whether funnel improvements translate to actual revenue growth.
Q3. Which metrics matter most in a funnel analysis?
Focus on conversion rates at each stage and overall funnel conversion rate. Secondary metrics like time in stage and lead quality scores provide additional optimization insights.
Q4. How often should I review funnel reports?
Weekly reviews help you spot trends quickly, while monthly reviews provide better data for optimization decisions. Quarterly reviews should focus on strategic funnel improvements.
Q5. What's the difference between funnel analytics and funnel reports?
Funnel analytics is the process of collecting and analyzing the data. Funnel reports are the formatted presentation of that analysis designed for specific audiences and decisions.